Plot with Mayavi in Jupyter notebook on Docker for Mac
Last update: 14 January, 2017
Install Docker for Mac
Install Xquartz
Install socat:
$ brew install socatBuild docker image:
FROM jupyter/datascience-notebook
MAINTAINER Taku Yoshioka <taku.yoshioka.4096@gmail.com>

USER root

RUN apt-get update && \
    apt-get install -y \
    libglu1-mesa

RUN apt-get update && \
    apt-get install -y \
    libvtk5-dev

RUN apt-get update && \
    apt-get install -y \
    mayavi2

RUN rm /bin/sh && ln -s /bin/bash /bin/sh

USER jovyan

ENV LIBGL_ALWAYS_INDIRECT 1

RUN source activate python2 && \
    conda install -y mayavi && \
    conda install -y -c conda-forge jupyter_contrib_nbextensions
RUN source activate python2 && \
    jupyter nbextension install --py mayavi --user
$ build -t jupyter-mayavi .Set indirect GLX flag to be used for Xquartz
$ defaults write org.macosforge.xquartz.X11 enable_iglx -bool true
Run Xquartz
Run socat
$ socat TCP-LISTEN:6000,reuseaddr,fork UNIX-CLIENT:\"$DISPLAY\"
Run docker container
$ ip=$(ifconfig en0 | grep inet | awk '$1=="inet" {print $2}')
$ docker run --rm -p 9000:8888 -e DISPLAY=$ip:0 --name test jupyter-mayavi
Launch a notebook with Python2 kernel
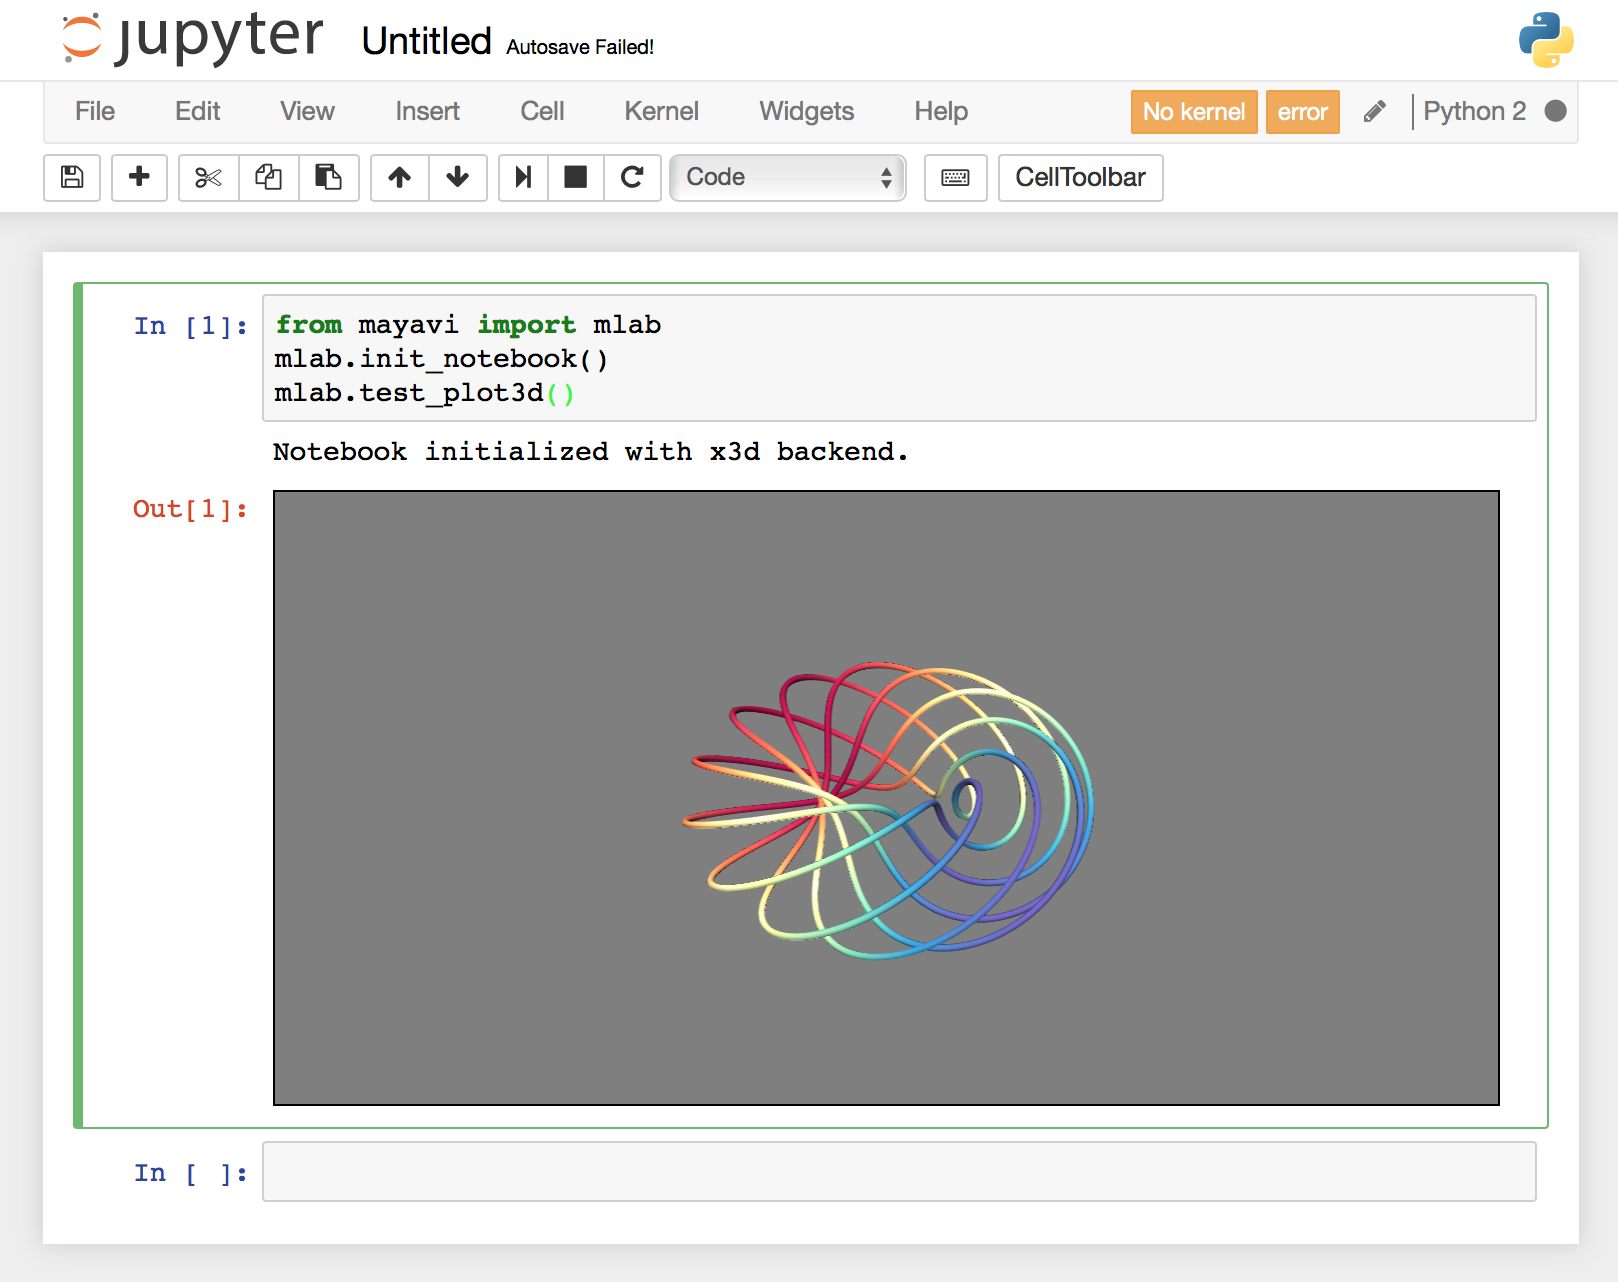
Run the following commands in the notebook:
from mayavi import mlab
mlab.init_notebook()
mlab.test_plot3d()